Seasonal Trends of Chronic Obstructive Pulmonary Disease and Asthma with a Meteorological Analysis in Korea: Using the National Health Insurance Service–Senior Database 2.0
Article information

Abstract
Background
Chronic obstructive pulmonary disease (COPD) and asthma can exacerbate the seniors’ quality of life and increase socioeconomic burden. We analyzed the seasonal trends of the average medical costs and hospital days, meaning admission days plus outpatient visit days, and the association of them with the meteorological factors.
Methods
The total number of people with COPD and asthma was 104,941 and 301,921, from 2002 to 2019, respectively. The information about hospital days and the medical cost were from the National Health Insurance Service-Senior Database 2.0. The meteorological factors included seasonal average temperature, daily temperature range, rainfall, wind speed, PM10, and PM2.5 from Korea Meteorological Administration and Korean Statistical Information Service. Analysis was done adjusted with age, by Pearson correlation coefficient, Spearman’s rank correlation coefficient, generalized linear mixed model, multiple regression, generalized additive mixed model analysis, and paired t-test.
Results
The severity of COPD and asthma appears to be lowest in fall, and winter is the second lowest burdensome season. The seasonal average cost of COPD was related with extreme temperature (P=0.0421). The seasonal average hospital days of COPD was related with extreme temperature (P=0.0267) and wind speed (P=0.0103). Both the seasonal average cost and hospital days of COPD may have negative correlation with humidity and positive correlation with wind speed. For asthma, the seasonal average cost was related with extreme temperature (P=0.0046) and the hospital days was related with extreme temperature (P=0.0074) and wind speed (P=0.0373). Both the average cost and hospital days of asthma had positive correlation with temperature and wind speed, and had negative correlation with humidity.
Conclusions
According to our analysis, seniors with COPD and asthma should also care their respiratory health during spring and winter. We suggest them to avoid extreme temperatures, dry environments, and strong winds to protect their respiratory health, save medical cost, and shorten hospital days.
INTRODUCTION
Pneumonia was the third leading cause of death from 2018 in Korea, except deaths from COVID-19. The first and second most cause of death were cancer and heart diseases, respectively. Many patients with cancer and heart diseases also experience pneumonia until death, and pneumonia could be the common cause of death for those patients. Likewise, respiratory health of old people has a significant association with death and quality of life.
Chronic respiratory diseases would exacerbate the respiratory health of old people and it will result as high socio-economic burden and poor quality of life. Chronic obstructive pulmonary disease (COPD) [1,2] and asthma [3] are among the most common chronic respiratory diseases and their socio-economic burden is currently increasing. As the progression of aging society is expected, the burden will increase and respiratory health of old population will be the more important issue in the future.
There are several factors with the prevalence and progression of COPD, genetic factors, age and sex, pulmonary growth and development and environmental factors. The environmental factors are smoking [4], biomass exposure, occupational pollutants and chemicals [5], air pollution [6,7], or socio-demographic index [8].
For asthma, two large factors, host factors and environmental factors, are associated with the prevalence and progression of asthma. Host factors are generally genetic factors [9], obesity [10], and sex [11]. Environmental factors are allergens [12], infection [13], occupational pollutants, stress, smoking, air pollution [14,15], or food.
We focused on the meteorological factors from environmental factors such as temperature, air pollution, humidity or wind speed.
In the big data analysis [7] in Korea, PM10 levels 1 day before acute exacerbation of COPD was associated with acute exacerbation and the monthly mean incidence rate of COPD acute exacerbation showed a similar trend with PM10 1 day prior to the acute exacerbation. In other study [16] examining the association between total suspended particle (TSP) concentrations and the relative risk of hospital admission due to respiratory diseases (COPD, asthma, and bronchitis), the relative risk showed a linear increase with higher TSP concentrations in all study locations.
The study [17] in USA with 12.5 million elderly individuals showed 4.7% increased risk of hospitalization for COPD for every 10 °F increase in ambient temperature. In the study [18] with 1990–2019 Global Burden of Disease data, every 1 °C increase in maximum temperature variability increased the risk of asthma by 5.0% globally, especially for individuals living in high latitude or aged from 50 to 70 years.
In the study [19] in Ganzhou, China, extremely low temperature and low humidity increased the risk of COPD death in Ganzhou city for males and people over 65 years old. In the systematic review about the effect of extreme weather events on asthma [20], extreme weather such as thunderstorm, heat waves or floods, was associated with increasing risks of asthma outcomes with relative risks of 1.18 for asthma events (95% confidence interval [CI] 1.13–1.24), 1.10 for asthma symptoms (95% CI 1.03–1.18), and 1.09 for asthma diagnoses (95% CI 1.00–1.19).
However, some studies suggested that the effect of air pollution, temperature, and other environmental factors does not have significant relationship with COPD and asthma. In the cohort study [21] of London with 812,063 patients without COPD diagnosis, hazard ratios (HR) for general practitioners recorded COPD and PM10, PM2.5 and NO2 were close to unity, positive for SO2 (HR=1.07, 95% CI 1.03–1.11, per 2.2 μg/m3), and negative for ozone(HR=0.94, 95% CI 0.98–1.00, per 3 μg/m3). Admissions HRs for PM2.5 and NO2 remained positive (HRs=1.05 [0.98–1.13] and 1.06 [0.98–1.15] per 1.9 µg/m3 and 10.7 µg/m3, respectively). In the study [22] of southwest China for asthma among older adults, CO and PM10 have a significant effect with risk of hospitalization for asthma on the population aged 65-69, however, there was no statistically significant effect on the population aged over 70. These statistical differences could vary by the region, characteristics of population, statistical evaluation, or measurement method.
This study tried to analyze how COPD and asthma is associated with the season, and some meteorological factors in Korea in little different ways. This study was approved with the Institutional Review Board (IRB) of the Seoul National University Hospital Center for Human Research Protection (IRB No. E-2603-028-1724) and also got approval from National Health Insurance Service (NHIS).
METHODS
Data source
We used the data of National Health Insurance Service-Senior (NHIS-Senior) database (DB) 2.0 of 2002–2019, until COVID-19. It is the cohort database for the research of diseases with old population established from 2008. It collected the data of people aged 60–80 in 2008 with national health insurance and from 2009–2019, it collected 8% of people aged 60 each year about individual information, healthcare utilization information, or nursing facility status information. It collected the data of 511,953 in 2008 and 545,831 in 2009–2019. The method of collection used stratified random sampling, and stratification was done for sex, age (1 year unit), region (big/medium city/rural area), and income decile.
For the environmental factors, we collected the most data from Korea Meteorological Administration (KMA). It provided the data of temperature, humidity, wind speed, and rainfall. Also we used data about PM2.5, PM10 from Korean Statistical Information Service (KOSIS). Data about PM2.5 and PM10 was provided from 2015 and 2010, respectively.
Independent variable
In Korea, the climatic factors vary significantly with seasonal variation. Therefore, we divided interval of time into every season of 2002–2019. Our data analysis started from the spring of 2002 to the fall of 2019. The range of the spring is from March to May, the summer from June to August, the fall from September to November, and the winter from December to February of the next year. The KMA provided seasonal data of average temperature and average rainfall. Since there were only monthly data for the wind speed and humidity, we averaged the monthly data into seasonal data. Likewise, the seasonal data was established with the monthly data of PM2.5 and PM10 from KOSIS. In Korea, PM2.5 and PM10 has a data only from 2015 and 2010 respectively.
Dependent variable
To evaluate the severity of COPD and asthma, we used the cost of total medical expenses and the number of outpatient visit days and admission days with the main diagnosis of COPD and asthma from the NHIS-Senior DB 2.0. For convenience, we call the number of outpatient visit days plus admission days as the number of hospital days. We considered patients visited hospitals for COPD as patients with main diagnosis code starting with J44, and for asthma, as patients with main diagnosis code starting with J45 and J46. This study divided the study period into four seasons. Accordingly, the expenses and total number of hospital days for COPD and asthma were assigned to each season based on the admission date or outpatient visit date.
During the analysis, we found out the age of seniors should be controlled since the cost burden and the number of hospital days of COPD and asthma are strongly related with the age of patients. Therefore, the age variable was always analyzed together.
Statistical method
We used Pearson correlation coefficient, Spearman’s rank correlation coefficient, generalized linear mixed model (GLIMMIX), multiple regression analysis, generalized additive mixed model (GAMM), and paired t-test. We consider statistical significance if P-value is less than 0.05. SAS Enterprise Guide 8.3 (SAS Institute) was used for analysis.
RESULTS
The total number of people with COPD (J44) and asthma (J45 and J46) diagnosis was 104,941 and 301,921, respectively. Table 1 shows the distribution of people with COPD and asthma diagnosis. Since it was the cohort database, each person may have different age group, different address, or different income decile every year. If their age group, address or income decile changed between 2002 and 2019, they may be counted more than once.
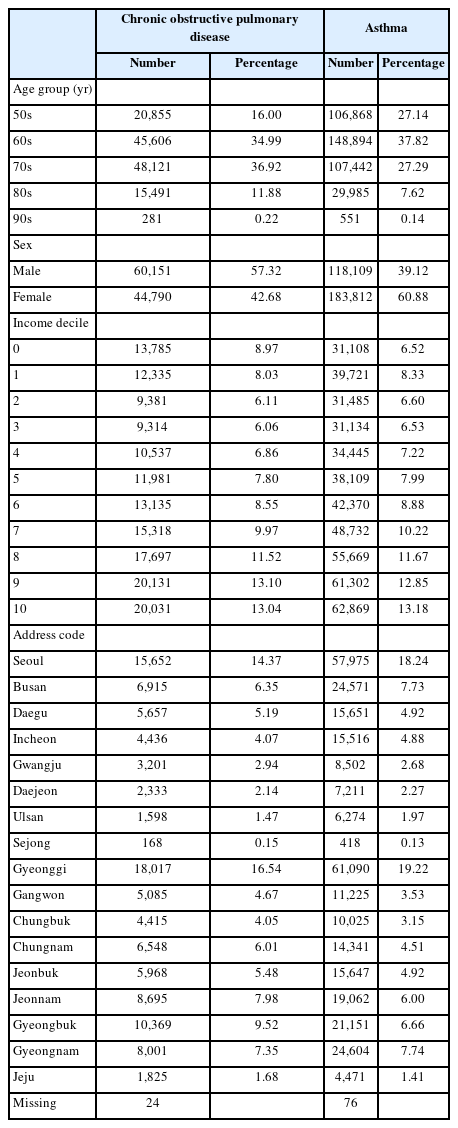
Demographics of study population
Fig. 1 shows the seasonal similarities every year of the meteorological factors. The rainfall and the temperature was high in summer, and low in winter. The daily temperature range was high in spring, and low in summer. The wind speed was high in spring and winter, and low in fall and summer. PM2.5 and PM10 was high in spring and winter, and low in fall and summer. The humidity was highest in summer, followed by fall, and low in spring and winter.
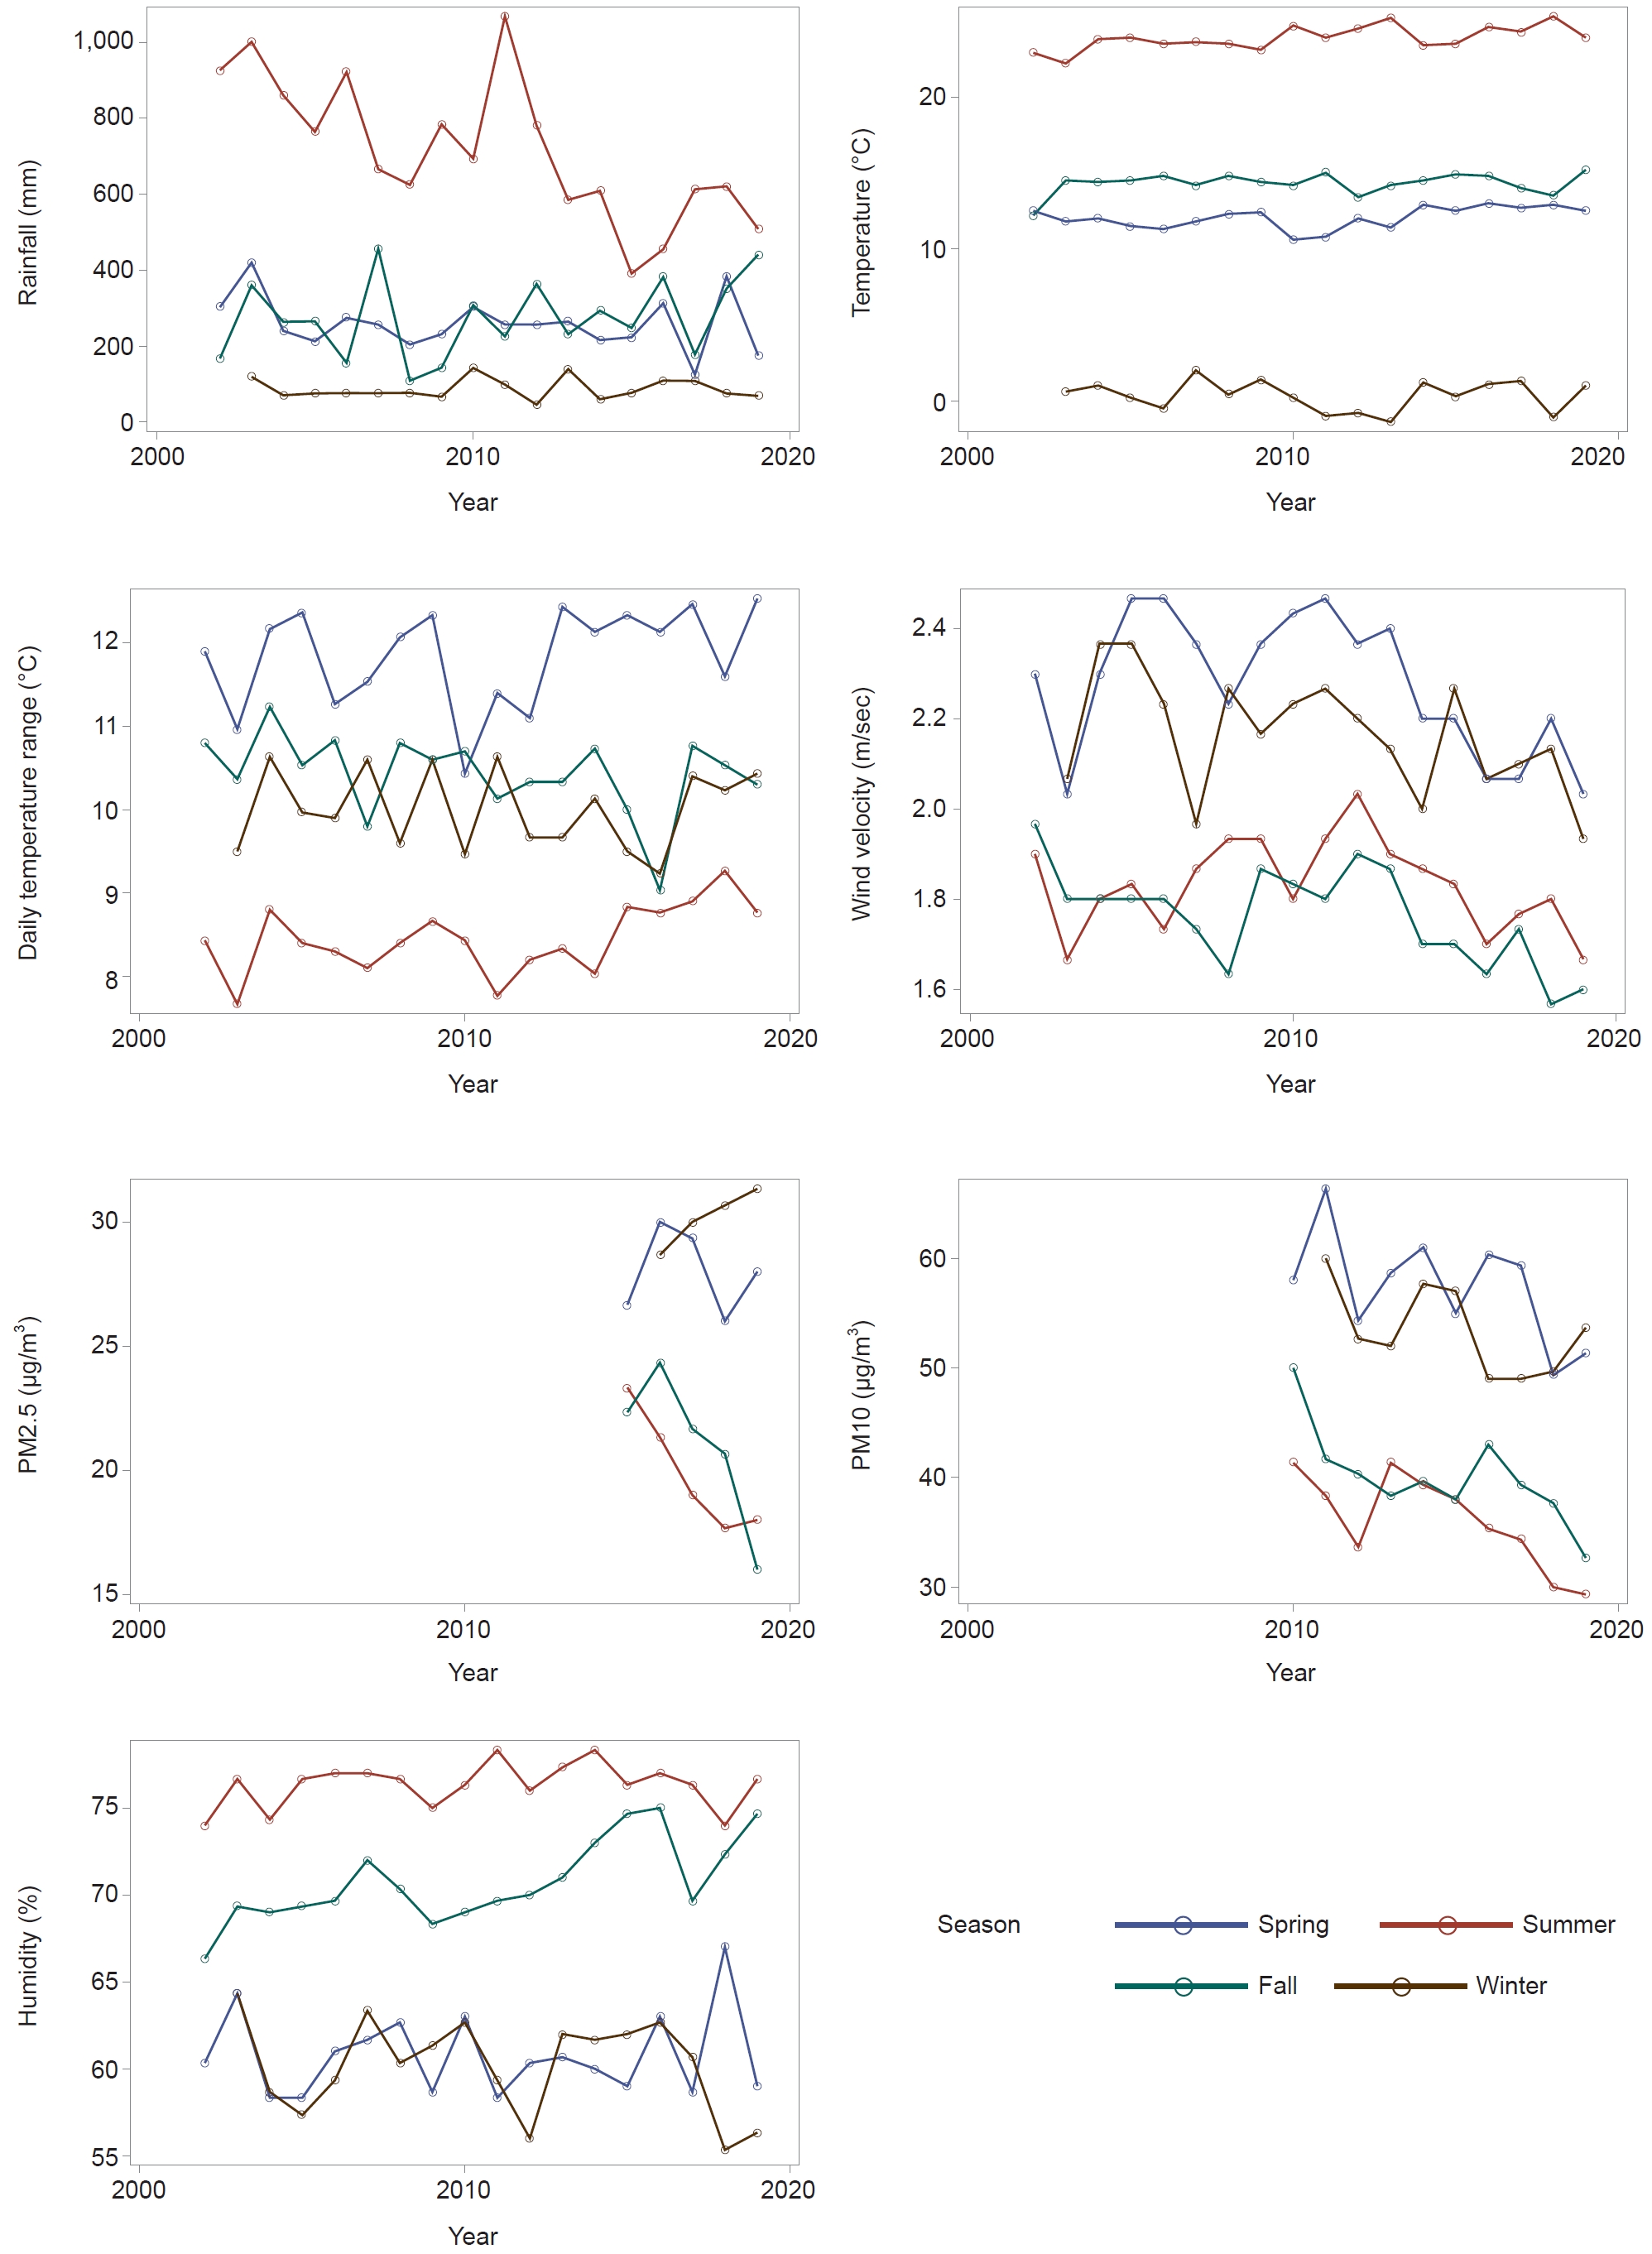
The seasonal meteorological factors (rainfall, temperature, daily temperature range, wind velocity, PM2.5, PM10, humidity) from 2002 to 2019.
The seasonal variation of average cost and the number of hospital days of COPD and asthma are shown above (Fig. 2).
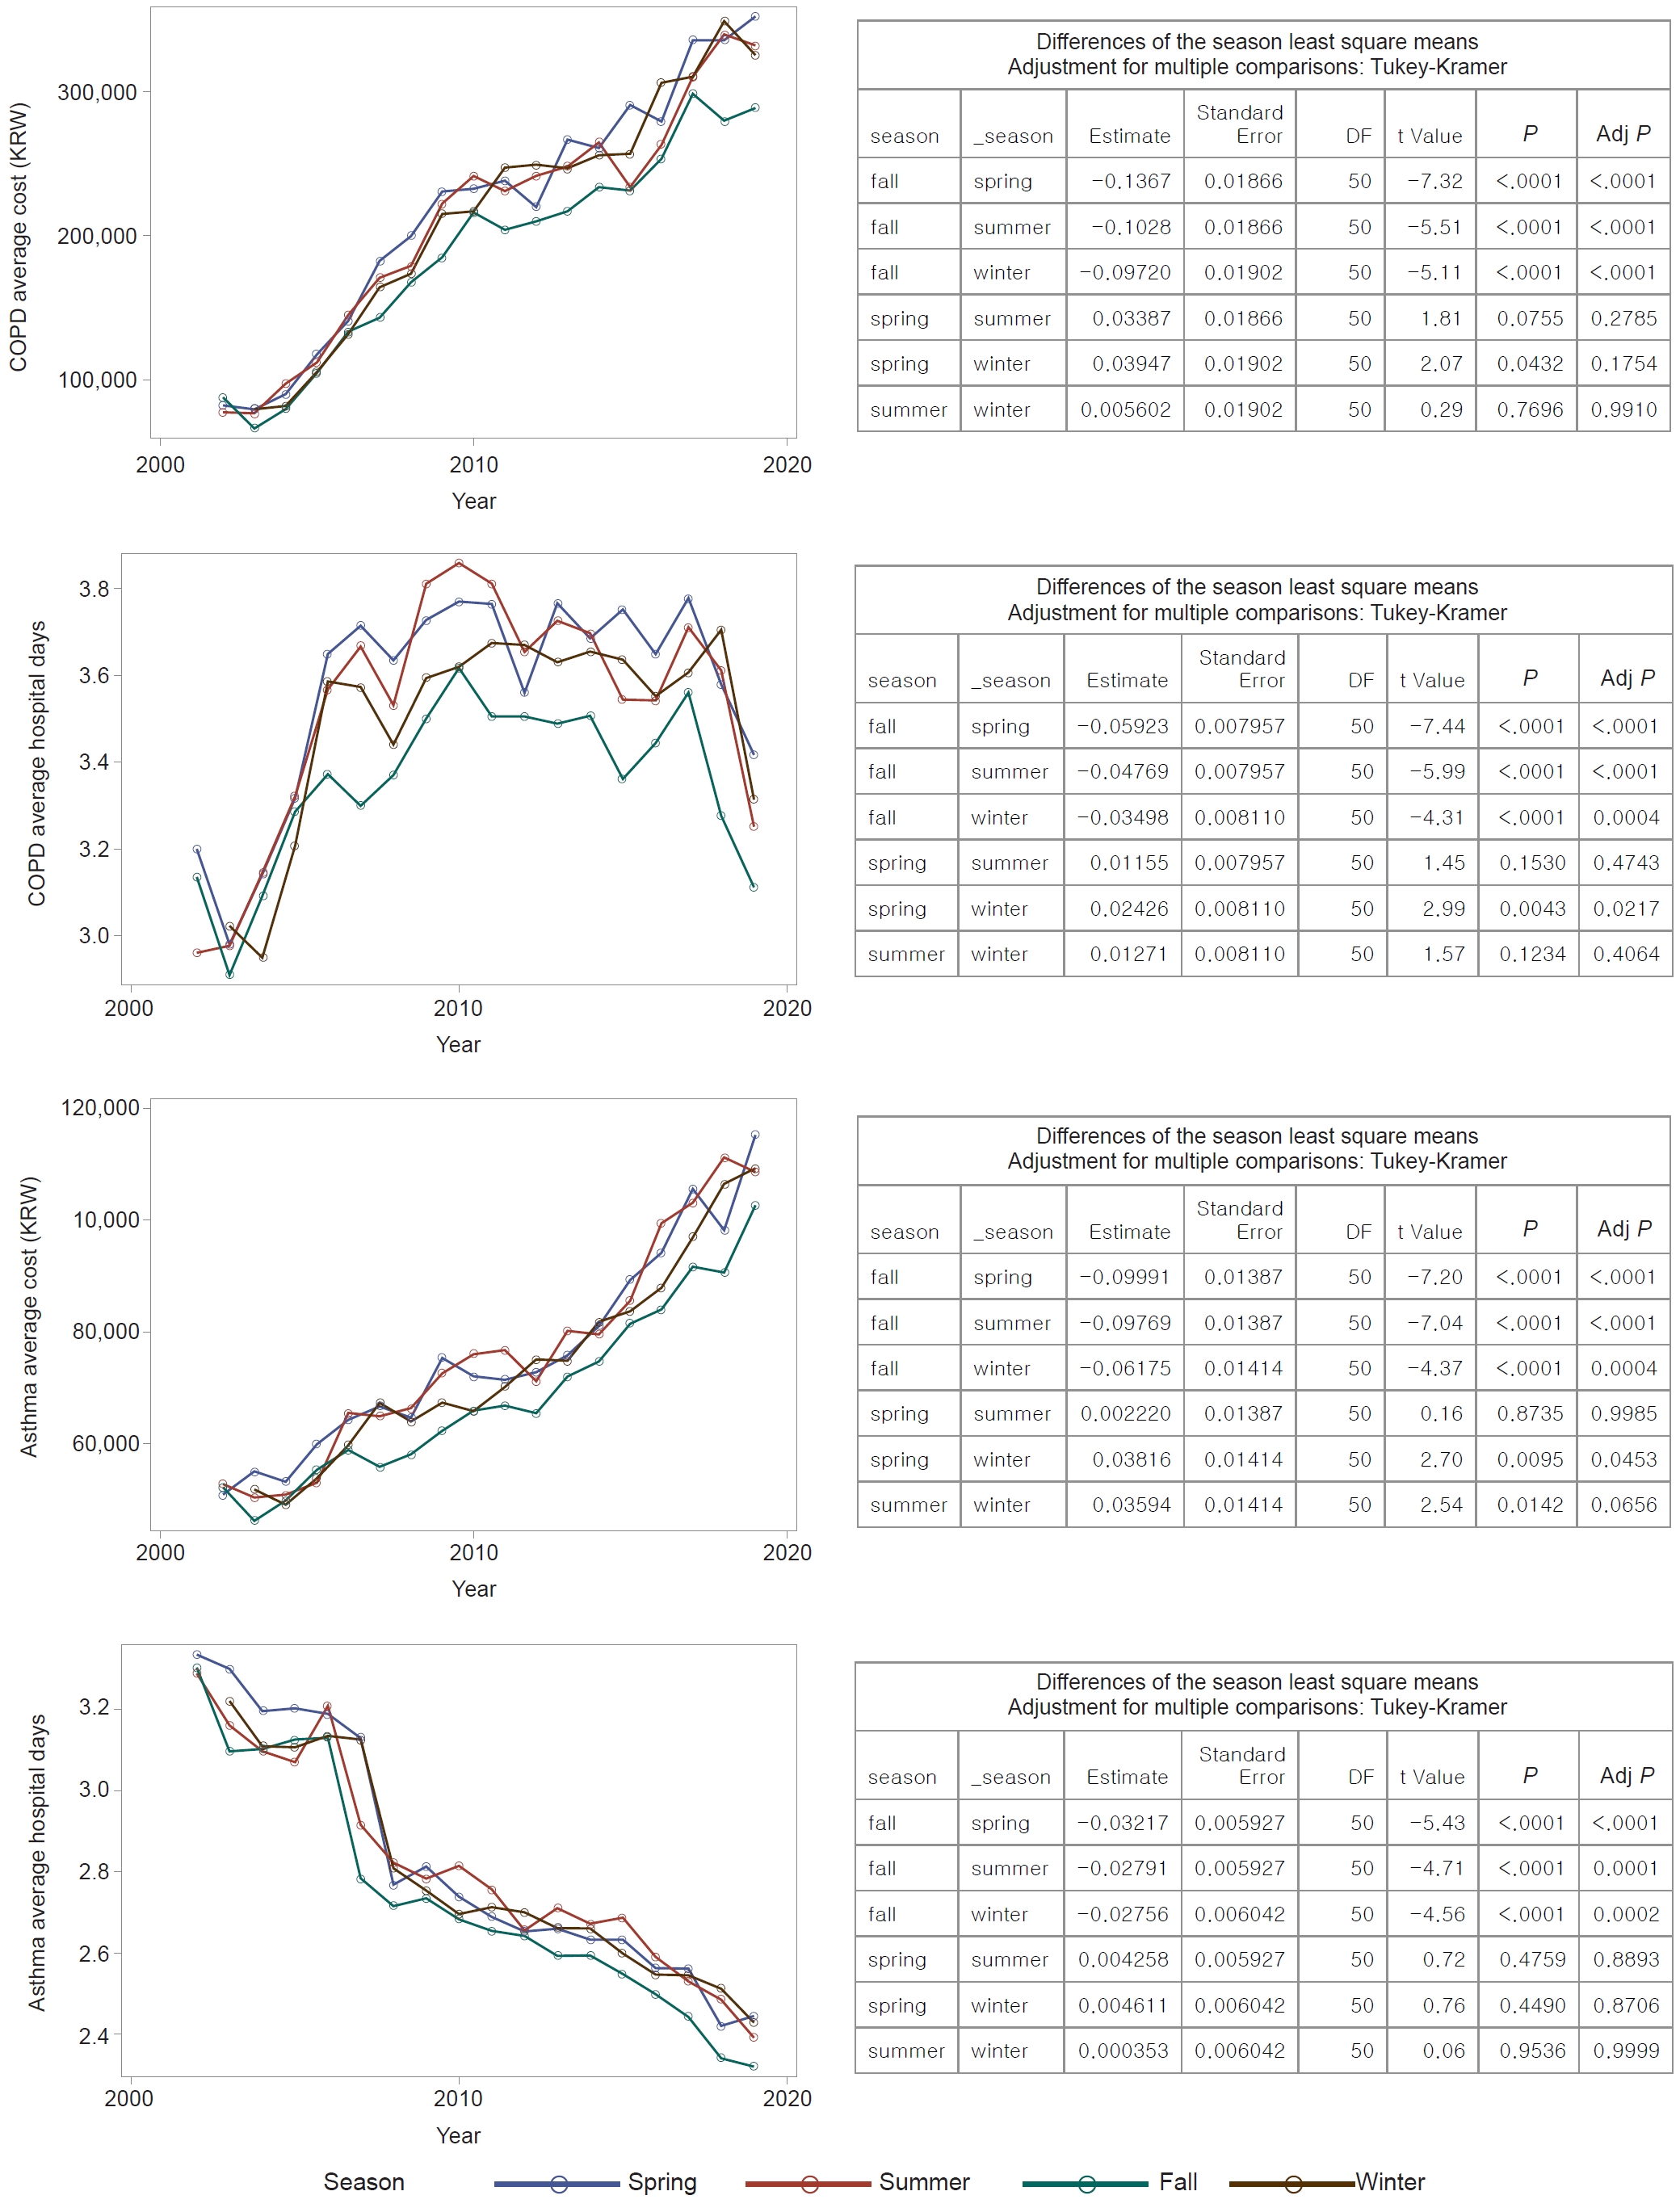
The graphs of the seasonal average cost and hospital days of COPD and asthma (Left) and the results of GLIMMIX analysis among seasons (Right). Adj P, adjusted P-value; COPD, chronic obstructive pulmonary disease; DF, degree of freedom; GLIMMIX, generalized linear mixed model.
The average seasonal cost of COPD was low in fall and it was statistically significant (P<0.0001 for the other seasons) with GLIMMIX. The average number of hospital days of COPD was low in fall (P=0.0004 or <0.0001) and high in spring than winter (P=0.0217) with statistical significance.
The average seasonal cost of asthma was lowest in fall (P=0.0004 or <0.0001) followed by winter and seems similar in summer and spring with GLIMMIX analysis. The average number of hospital days for asthma was lowest in the fall (P=0.0002 or <0.0002) and followed a downward-right trend, which was different from the patterns observed in other seasons.
From the analysis, we used copd_avg_cost, copd_avg_adm, asthma_avg_cost, and asthma_avg_adm for the variables the seasonal average cost of COPD patients, the seasonal average hospital days of COPD patients, the seasonal average cost of asthma patients, and the seasonal average hospital days of asthma, respectively. The variables copd_avg_age and asthma_avg_age mean the seasonal average age of COPD patients and the seasonal average age of asthma patients. The variable temp_range means the seasonal average daily temperature range. This will applied to following analysis.
Table 2 shows the association of each meteorological factors with the seasonal average cost and hospital days of COPD and asthma. Age was strongly associated with the cost and the number of hospital days (P=0.0003 or <0.0001). For COPD, age had a positive correlation with the cost and the number of hospital days. For asthma, age had a positive correlation with the cost, but a negative correlation with the number of hospital days.
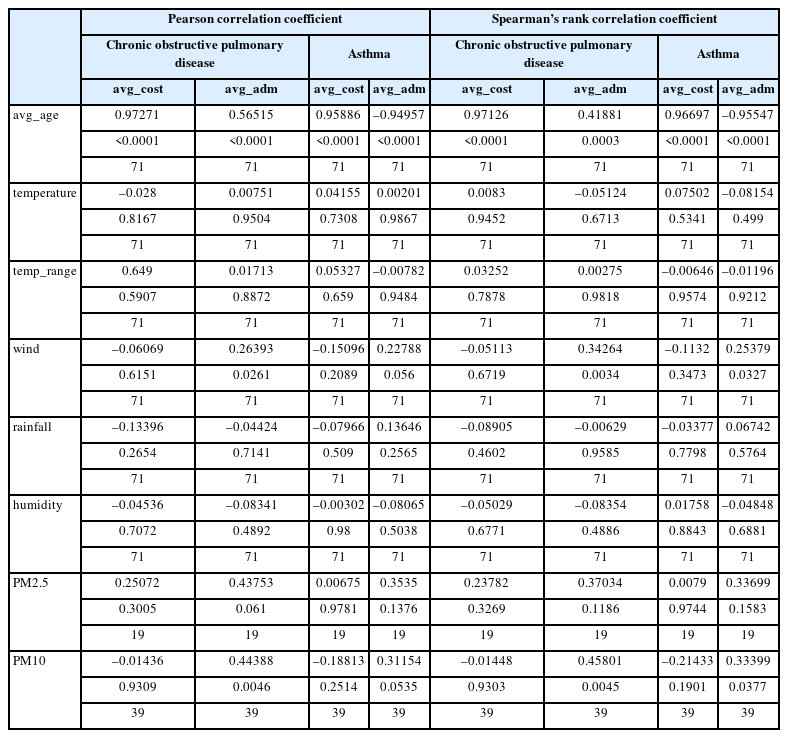
Pearson correlation coefficient & Spearman correlation coefficient of the each variables
The cost of COPD and asthma had no statistically significant correlation with all environmental factors we analyzed, the temperature, the daily temperature range, humidity, rainfall, wind speed, PM10, and PM2.5.
The number of hospital days of COPD had a positive correlation with the wind speed and PM10 (P<0.05). Other factors had no statistically significant correlation, but PM2.5 had a positive correlation with low P-value (0.0610 for Pearson correlation coefficient, 0.1186 for Spearman’s rank correlation coefficient).
For asthma, the number of hospital days had a positive correlation with wind speed and PM10. For Pearson correlation coefficient, P-value was 0.0560 and 0.0535, respectively. For Spearman’s rank correlation coefficient, P-value was 0.0327 and 0.0377, respectively.
Since we see the strong relationship of the age with cost and the number of hospital days, the age was always controlled through all analysis. Also, since we have less data, PM10 and PM2.5 were analyzed separately with other variables. We grouped independent variables into rainfall and humidity, temperature, temperature range and wind speed, and all independent variables together for multiple regression. Each multiple regression analysis was done and Table 3 is the result.
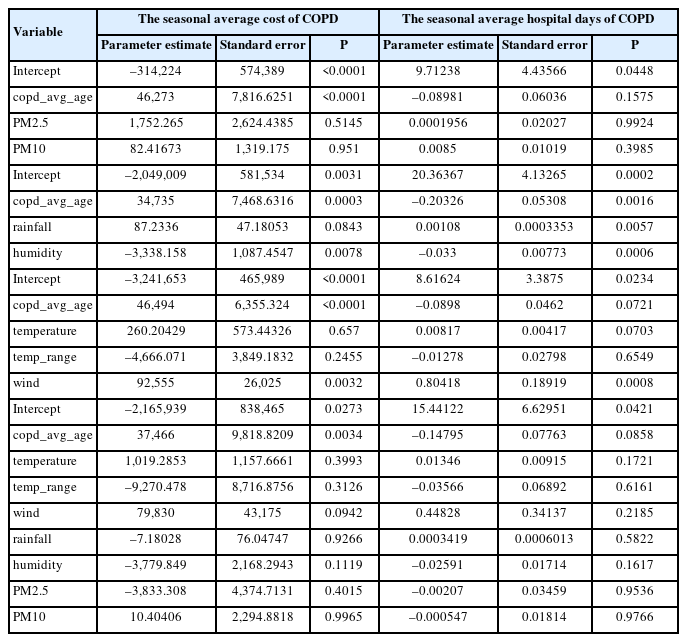
Multiple regression analysis of COPD
For COPD (Table 3), PM2.5, PM10, temperature, and daily temperature range was not statistically associated with the cost. The wind speed (P=0.0032) and humidity (P=0.0078) had statistically significant relationship with the cost when analyzed separately. Average hospital days were not statistically associated with PM2.5, PM10, temperature, daily temperature range, but had a relationship with the wind speed (P=0.0008), rainfall, and humidity (P=0.0006). For the hospital days, less strong relationship was shown with the age, and the age had a negative correlation with the hospital days.
For asthma (Table 4), PM2.5, PM10, temperature, and daily temperature range had no significant relationship with the cost. Humidity had a negative correlation (P<0.05), and the rainfall and wind might have positive correlation when analyzed separately. Average hospital days were not statistically associated with daily temperature range, rainfall, PM2.5 and PM10. However, humidity had a negative correlation (P<0.05), and temperature had a positive correlation (P<0.05). Wind speed might have positive correlation. Similar with COPD hospital days, the age had a negative correlation with the hospital days.
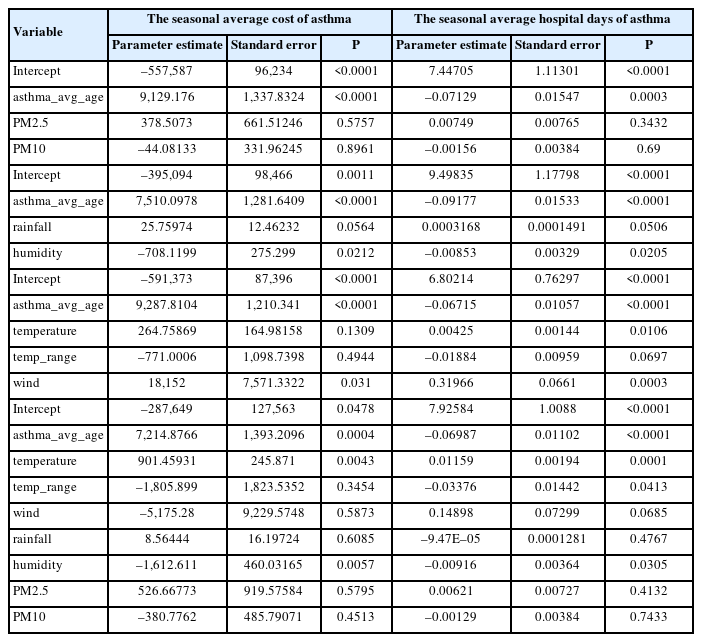
Multiple regression analysis of asthma
Table 5 shows the results of GAMM analysis. We did not include PM10 and PM2.5 in analysis because data size was too small to analyze. Variable year is included as the random effect. To avoid overfitting, we limited degrees of freedom to 2, which can explain U shape model or inverted U shape model. Age and temperature range were assumed to have a linear association rather than a U-shaped or inverted U-shaped relationship. Therefore, spline was not applied to these variables to avoid overfitting.
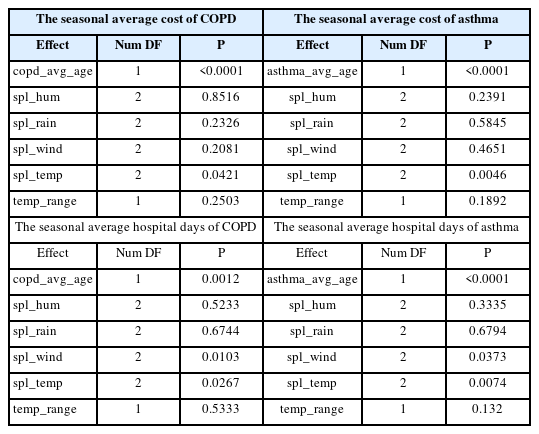
GAMM analysis of COPD and asthma
As a result for COPD, the temperature was the only factor associated with the average cost of COPD except age. Average hospital days had a correlation with wind speed and temperature. For asthma, only temperature had a correlation with average cost, and wind speed and temperature had a correlation with average hospital days. However, this GAMM analysis was little overfitted, which might be due to small data size or too many variables.
We analyzed the difference between male and female (Table 6). Average cost of COPD was not statistically different, although mean cost was higher in male. Average cost of asthma was statistically different (P=0.0184), and the cost for female was higher. The hospital days of COPD was statistically different (P=0.0007), and female had a higher value. On the other hand, the hospital days of asthma was not statistically different, and the mean value was slightly higher in male.
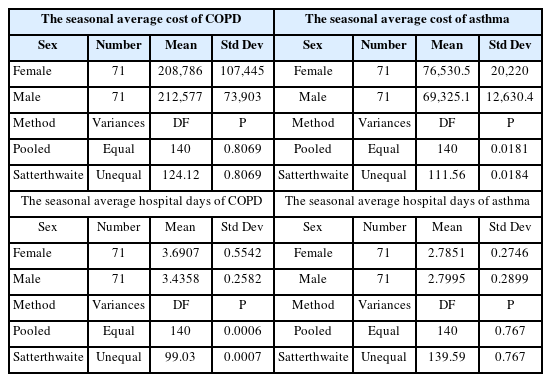
T-test for the seasonal average cost and hospital days of COPD and asthma between sex
DISCUSSION
From the results, we could see the seasonal difference of the cost and hospital days of COPD and asthma. Furthermore, we could analyze the association with the meteorological factors and the cost and hospital days of COPD and asthma.
The known exacerbation factors for COPD include low temperature, drastic temperature variability, extreme humidity, air pollution, or other seasonal respiratory infection. For asthma, low temperature, high humidity, high daily temperature range, air pollution, and allergen factors can cause exacerbation.
In Korea, fall and winter are usually considered more vulnerable to exacerbation of COPD and asthma. However from our analysis, the average cost and hospital days of COPD and asthma were lowest in the fall, and often high in spring. We further analyzed the total seasonal number of the patients, the total seasonal medical cost, and the total seasonal hospital days for COPD and asthma patients (Table 7). The results were similar and the analysis of the difference among seasons are done by GLIMMIX method. The spring and winter had more number of patients, more cost burden, and more hospital days than the fall and summer (P<0.05). Since the number of patients of COPD and asthma were more in fall than in summer (P<0.05), fall was the least burdensome season.
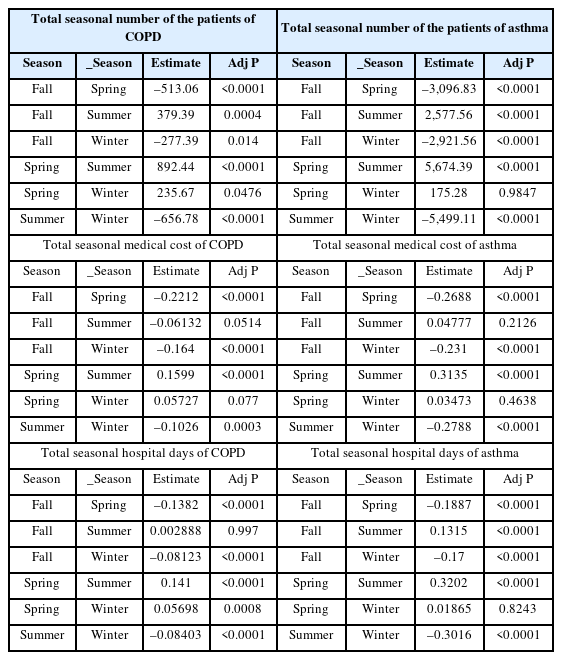
The result of GLIMMIX analysis for total seasonal values among seasons
In Fig. 1, we could see the graph of rainfall, temperature, daily temperature range, and humidity of fall is in the middle, which means the weather is usually not extreme. Also, wind speed, PM 2.5, and PM 10 are low in fall. Wind can spread allergens and air pollutants [23], and may also cause inhalation of cold, dry, or excessively humid air. Thus, low wind speed, PM 2.5, PM 10 has low possibility for exacerbation. Another possible explanation is that people use air conditioners and heaters less frequently in fall, which may result in better respiratory health.
Another interesting finding was that the number of hospital days for asthma showed a downward trend, whereas that for COPD exhibited an inverted U-shaped like pattern, not exactly a right-upward linear pattern. We analyzed a cohort database, therefore, participants naturally became older over time and more susceptible to COPD and asthma, which may have contributed to the upward trend in hospital days. This trend might be explained by survivor bias, changing both slopes to downward trend. Although the average hospital days decreased, the average cost had increased. It suggests that more examinations and intensive treatments were given to older patients who may have more comorbidities, and inflation was also a contributing factor. There should be more research about the reason why the survivor bias influence in asthma earlier than in COPD for seniors.
Wind speed and humidity might have rather stronger association with COPD than other meteorological factors. For asthma, wind speed, temperature and humidity might have stronger association than other factors. The results suggest old patients with COPD and asthma should avoid dry condition, strong wind, and hot temperature. Previous studies suggested that the extreme humidity and temperature can cause more exacerbation, and it may suggest that Korea is not the country with extremely high humidity and extremely low temperature.
With Spearman's rank correlation coefficient from Table 2 and Table 5, in the view point of non-linear association of variables, temperature and wind speed could be the only factors associated with the average cost and hospital days of COPD and asthma. Our results indicate that temperature is associated with both the average cost and hospital days for COPD and asthma, consistent with findings from previous studies. Also, according to the previous studies, extreme wind speed is associated with average hospital days of COPD and asthma. High wind speed can carry air pollutants into the respiratory system and stimulate mucous membrane, thereby exacerbating COPD and asthma. Low wind speed can trap air pollutants and deteriorate air circulation, thereby exacerbating COPD and asthma.
More males are prone to have COPD, but the average cost burden of COPD was not significantly different between sex and the average number of hospital days was higher in female. The previous study in Europe, the severity of symptoms related with COPD was similar with sex, but the female has slow tendency to respond to the treatment [24]. In asthma, the female has a higher average cost burden, whereas the average number of hospital days is similar between males and females. The systematic review reported that the treatment for asthma was generally less effective in women, and 44% (the opposite was 17%) of evidence reported that the male responded better than the female to the treatment, whereas this percentage was 28% (the opposite was 26%) in COPD [25]. Especially ICS treatment for asthma responded significantly better for men. Also, female hormones trigger respiratory inflammation and allergic reactions, on the other hand, male hormones often play opposite role [26].
Limitation & strength
During analysis, we found difficulty with analyzing the meteorological factors with COPD and asthma. There were numerous different ways to evaluate meteorological factors. Some studies used average temperatures of 3 days before visiting emergency department due to COPD, or daily temperature change of the day before the admission due to COPD. Meteorological factors are analyzed by various ways, and in Korea, seasonal meteorological variation is relatively distinct and we seemed that analysis with seasonal time interval would be meaningful to know the results.
We used patients’ data from NHIS, and meteorological data from KMA and KOSIS. The data from KMA and NHIS had different regional border, therefore it was hard to analyze with more specific regional meteorological factors. It may be possible for some regions, since KMA system has the meteorological data of Seoul plus Gyeonggi plus Incheon, or Daegu plus Gyengbuk. However, some regions like Gangwon, KMA suggest that climate is different among left and right area of Taebaek mountains and Taebaek mountains, therefore, it does not provide exact data of total Gangwon's climate. Instead, it provides the data of Gangwon Yeongdong and Gangwon Yeongseo. It is possible to analyze in more specific regions if we only include the patients of COPD and asthma in smaller regions, for examaple, Seoul and Gyeonggi or only Seoul.
As a strength of our study, few previous studies have included various meteorological variables in Korea. By analyzing these variables together, we could estimate the effect of variables minimizing the correlation of each variables.
Many studies used the visit number of emergency departments or hospitals to evaluate the exacerbation of COPD and asthma. It would be difficult to include the severity of hospital visit. Our study, on the other hand, evaluated the expense of medical cost and the number of hospital days, which can reflect the severity of diseases more.
We analyzed data from 2002 to 2019 with seasonal variation, which showed the trend of relatively long period. Thus, our analysis may show general correlation of the medical burden of COPD and asthma with meteorological and seasonal factors.
Conclusion
The analysis showed that the severity of COPD and asthma in the point of the cost burden and the number of hospital days seems lowest in fall. For other seasons, the details differ, but winter seems to be the second least burdensome season. Spring and summer are thought to be a good weather with the chronic respiratory diseases, however, according to our analysis, people with COPD and asthma should care about their respiratory health also in spring and summer. For meteorological factors in Korea, we suggest that patients with COPD and asthma should avoid extreme temperature, dry environment and strong wind for their respiratory health.
Notes
AUTHOR CONTRIBUTIONS
Dr. Belong CHO had full access to all of the data in the study and takes responsibility for the integrity of the data and the accuracy of the data analysis. All authors reviewed this manuscript and agreed to individual contributions.
Conceptualization: TL and BC. Data curation: TL and BC. Formal analysis: TL and BC. Methodology: TL and BC. Software: TL and HS. Writing–original draft: TL. Writing–review & editing: TL and BC.
CONFLICTS OF INTEREST
No existing or potential conflict of interest relevant to this article was reported.
Funding
None.
DATA AVAILABILITY
The data presented in this study are available upon reasonable request from the first author and corresponding author. The meteorological data are available in KMA and KOSIS for free, and the data about the seasonal medical cost and the hospital days are from NHIS - Senior cohort database 2.0 with data fee.